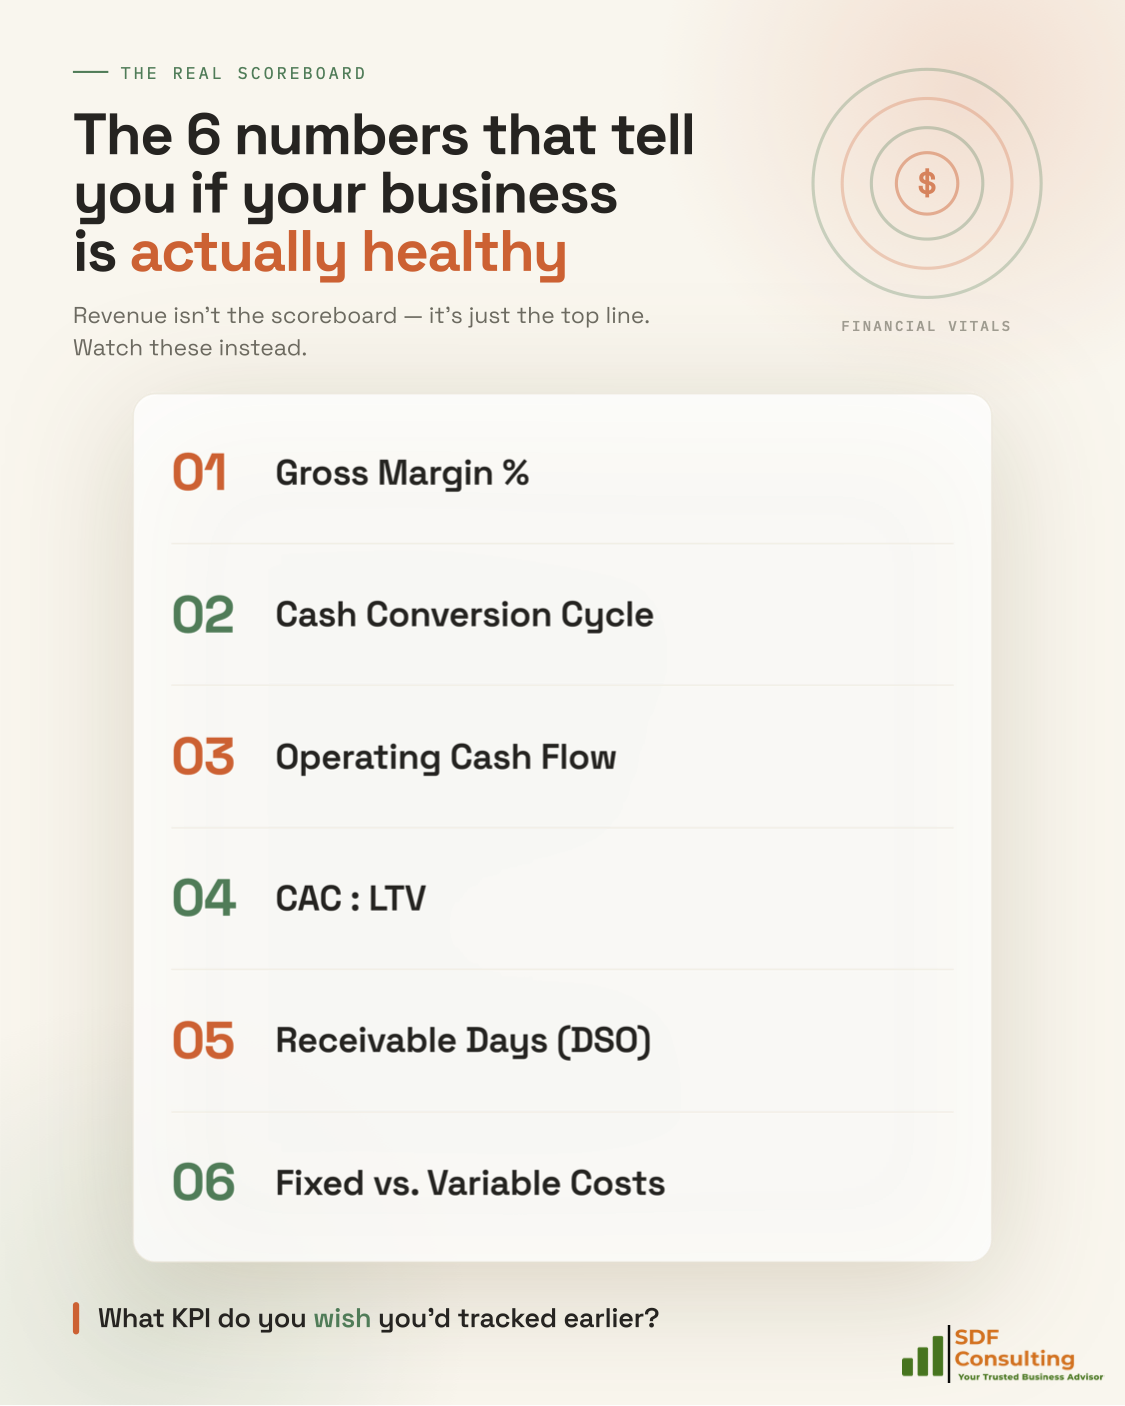
The 6 Numbers That Tell You If Your Business Is Actually Healthy
Most small business owners are measuring the wrong things — and it’s costing them everything.
Revenue feels like the scoreboard. You close a big month, the top line looks strong, and confidence settles in. But revenue is just the beginning of the story. Businesses that chase it without understanding the mechanics underneath don’t fail loudly — they fail quietly, slowly, and often without warning.
The owners who build durable businesses aren’t necessarily the ones with the biggest numbers. They’re the ones who understand which numbers actually matter. Here are the six metrics that tell you the real story.
1. Gross Margin Percentage — Know Your Floor Before You Celebrate Your Revenue
Gross margin is the percentage of revenue you keep after subtracting the direct cost of delivering your product or service.
(Revenue – Cost of Goods Sold) ÷ Revenue × 100
If your gross margin is 20%, every dollar of revenue leaves you just 20 cents to cover rent, payroll, software, and profit. At 60%, you have room to invest, absorb setbacks, and grow. A high-revenue business with a thin margin can be fundamentally weaker than a smaller business with a healthy one. Before you celebrate a big month, ask whether the margin held.
2. Cash Conversion Cycle — How Fast Does Effort Turn Into Cash?
The Cash Conversion Cycle measures how long it takes to convert investments in inventory, labor, or materials into actual cash.
CCC = Days Inventory Outstanding + Days Sales Outstanding – Days Payable Outstanding
A business can be profitable on paper and still run out of cash because money is tied up in unpaid invoices or unsold inventory. This is one of the most common ways growing businesses get into trouble — more work coming in, but cash not flowing fast enough to fund it. Invoice faster. Collect sooner. Shorten the cycle wherever you can.
3. Operating Cash Flow — Profit Is an Opinion. Cash Is a Fact.
Accounting gives you profit. Reality gives you cash flow. They are not the same thing.
Operating cash flow shows the actual cash your business generates from core operations — after wages, suppliers, rent, and every real cost of running the business. A company showing strong net profit can simultaneously be burning through reserves due to poor collections or aggressive expansion. The profit line says you’re doing well. The cash flow statement tells you whether you can make payroll next month.
Track this monthly, not quarterly. Cash problems don’t announce themselves in advance.
4. CAC vs. LTV — The Ratio That Determines Whether You Have a Business
- Customer Acquisition Cost (CAC): Total marketing and sales spend divided by new customers acquired.
- Customer Lifetime Value (LTV): Total gross profit a customer generates over their entire relationship with your business.
If it costs $300 to acquire a customer who only ever spends $280, you don’t have a business — you have a mechanism for converting marketing spend into losses at scale. The benchmark most operators aim for is an LTV:CAC ratio of at least 3:1. If you’re only counting first transactions and ignoring repeat purchases, referrals, and upsells, you’re undervaluing your customers and making worse decisions because of it.
5. Days Sales Outstanding — Every Dollar in Receivables Is an Interest-Free Loan to Your Customer
DSO measures how long it takes, on average, to collect payment after a sale.
(Accounts Receivable ÷ Total Revenue) × Number of Days in Period
If your DSO is 45 days on net-30 terms, you have a collections problem. You’re financing your customers’ operations — without interest and without their gratitude. High DSO strains cash flow and introduces credit risk if customers become unable to pay. Set clear payment terms, send invoices immediately, and follow up systematically. Every day you reduce your DSO improves your cash position without making a single additional sale.
6. Fixed vs. Variable Cost Ratio — Your Fixed Costs Will Break You Before Your Competitors Do
Fixed costs — rent, salaries, insurance, subscriptions — hit whether you closed ten deals or zero. Variable costs flex with revenue. The ratio between them determines your break-even sensitivity: how quickly a revenue dip becomes a crisis.
Every time you hire full-time, sign a long-term lease, or add a recurring subscription, you raise your floor. That’s not inherently bad, but every owner should know exactly where their break-even sits and how much runway remains if revenue drops 20% or 30%.
The Gap Where Businesses Fail Quietly
Most accounting software surfaces all of this. QuickBooks, Xero, FreshBooks — the data is there. The problem isn’t access. It’s attention.
Most owners glance at the P&L summary, see revenue trending up, and move on. They never check cash flow. They never calculate their CAC:LTV. They never look at how long their receivables are aging. And then one slow month — or one late-paying client — hits the business like it came out of nowhere.
It didn’t. The warning signs were in the numbers the whole time.
Financial health isn’t about a strong revenue month. It’s about understanding whether that revenue is actually building something that lasts.
Which KPI do you wish you’d tracked earlier? The answer usually reveals the exact lesson that cost the most to learn.